How Much do Solar Panels Cost in California?
California is the top state in the US for residential solar. But one question remains for many homeowners – how much does solar actually cost? We’ve put together this study to give you an idea of how much solar costs in your region of the state.
Solar to the People’s Cost of Solar Index for California
Homeowners in California are installing solar on their homes at an unprecedented rate. Although the California solar market is growing every day, solar prices still remain somewhat of a mystery. That’s why we’ve done the research and compiled our Cost of Solar Index for California – to show homeowners what their neighbors are actually paying for solar power across the state.

The Cost of Solar Panels in California
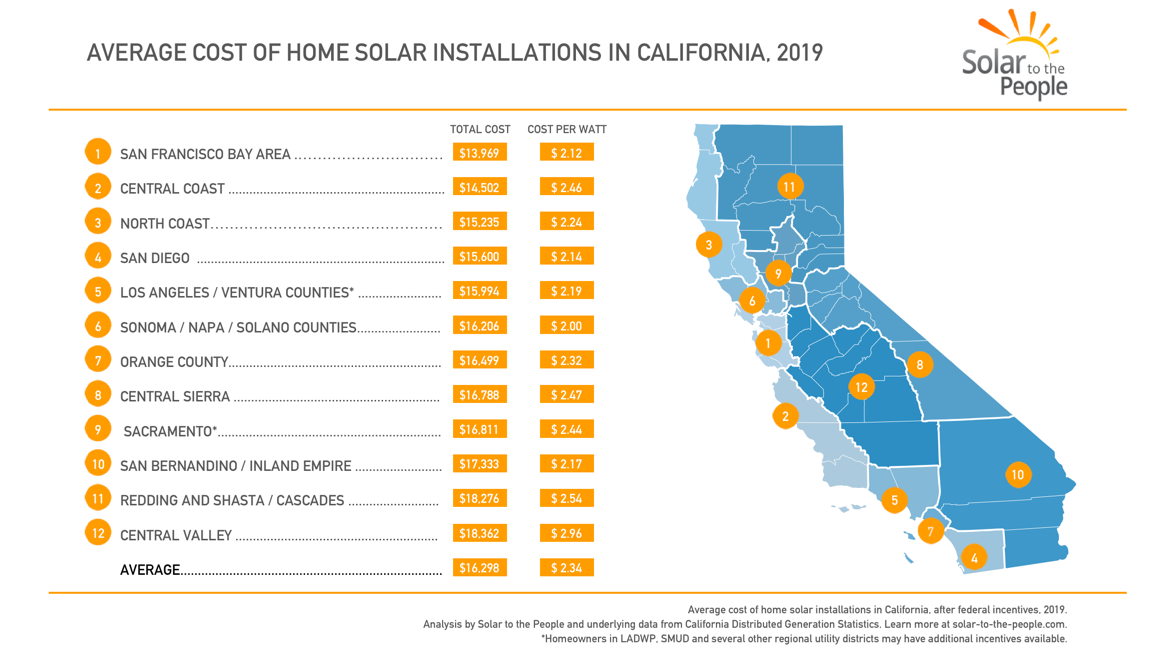
The average cost of residential solar installed in California in 2019 was $16,298. As shown in the above map, that price varies by several thousand dollars depending on the region. These prices are solar installations purchased with a loan or cash, they do not apply to leased systems or power purchase agreements.
Of course, a solar panel calculator is always the best option for determining cost at a particular location.
Overall, the highest average prices ($18,362) are in the Central Valley and Redding and Shasta/Cascades region, while the lowest average prices ($13,969) can be found in theSan Franciso Bay area. The map above shows how much homeowners across California paid to install residential solar panels in 2019 after the federal incentive (the federal solar investment tax credit) had been applied.
*Note that customers served by the Los Angeles Department of Water and Power or Sacramento Municipal Utility District, as well as other smaller utility districts, may be eligible for additional rebates from their utility, reducing the cost of solar further.
Cost of Solar in California in 2019, at a Glance:
$16,298
Average Cost of a Home Solar Installation in California
This is the average price for PURCHASED residential solar systems AFTER federal incentives in 2019.
7.0 kW
Average Size in kW of Home Solar Installations in California
System sizes vary from house to house, but the average size for California residential systems was 7.0 kW in 2019.
$2.34
Average Price per Watt of Solar in California
AFTER the federal incentive, this is the average price paid per watt of solar in California in 2019.

The Average Cost of Solar Installations in California
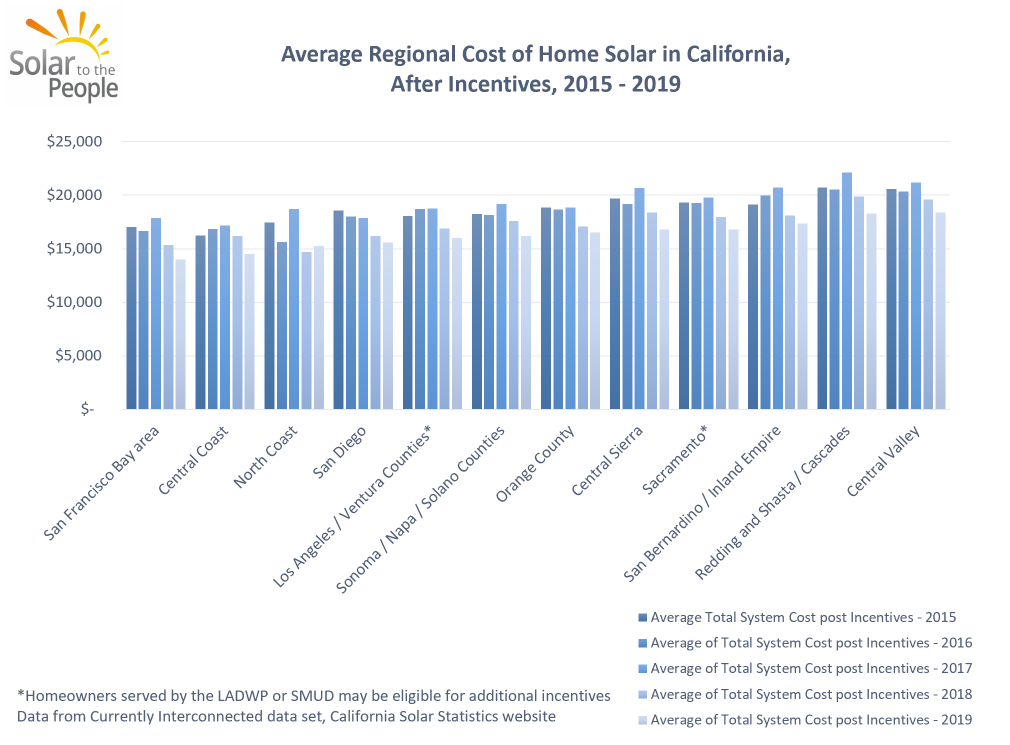
The overall price of a residential solar system (not to be confused with the price per watt – see below), in 2019 is $16,298. This includes the federal incentive (the federal solar investment tax credit), but ignores any of the regional incentives homeowners may be eligible for (California solar rebates are no longer available in areas served by PG&E, SoCal Edison, or SDG&E). Overall costs for home solar systems have stayed shockingly stable since 2015, with our data indicating that the average price in 2015 was $18,679, and in 2016 it was $18,497. However, while system prices have stayed stable, declines in price per watt have led to homeowners being able to buy progressively larger systems for the same price. We look at this interesting twist in the cost of solar in California below.
| Region | Average of Total System Cost After Incentives – 2019 |
|---|---|
| Central Coast | $ 14,502 |
| San Francisco Bay area | $ 13,969 |
| San Diego | $ 15,600 |
| North Coast | $ 15,235 |
| Sonoma / Napa / Solano Counties | $ 16,206 |
| Los Angeles / Ventura Counties* | $ 15,994 |
| Orange County | $ 16,499 |
| Sacramento* | $ 16,811 |
| Central Valley | $ 18,362 |
| San Bernardino / Inland Empire | $ 17,333 |
| Central Sierra | $ 16,788 |
| Redding and Shasta / Cascades | $ 18,276 |
| Average | $ 16,298 |

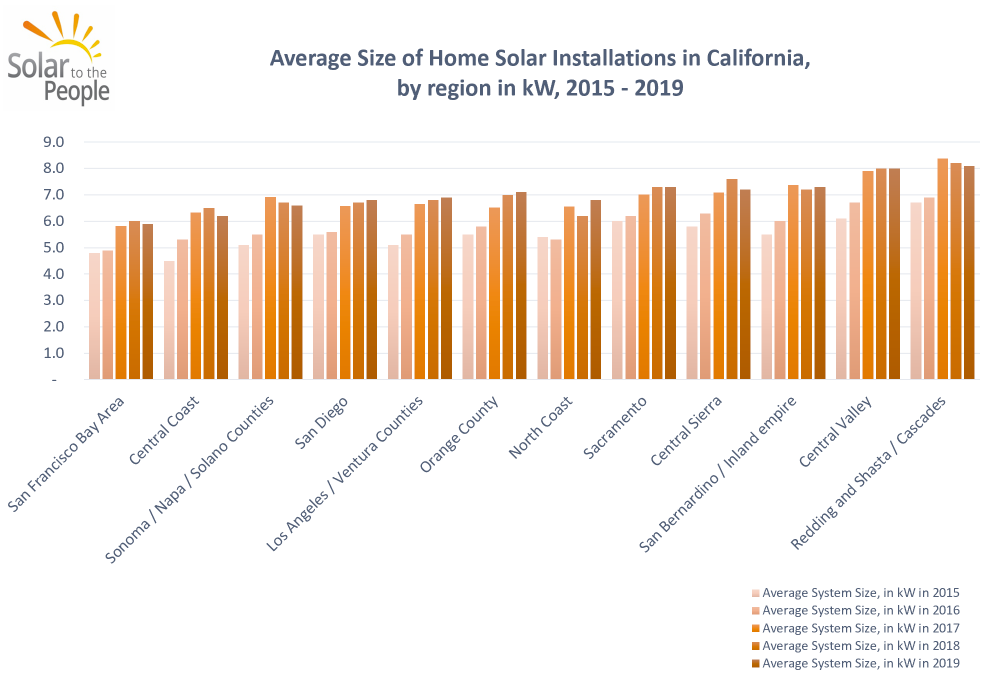
The Size of Solar Installations in California
The size of a residential solar system depends on the amount of power you need, and on the size of your roof and amount of sunlight it receives. In areas where prices per W are cheaper and there’s enough space, homeowners generally add as many panels as possible. Across California, the average system size of a solar panel system installed in the first six months of 2017 was 6.1 kW – a significant increase over the average 5.5 kW of 2015 and 5.8 kW of 2016. As you can see, the biggest installations on average occur in the Redding and Shasta/Cascades region (8.1 kW), while the smallest installations are in the San Francisco Bay region (5.9 kW).

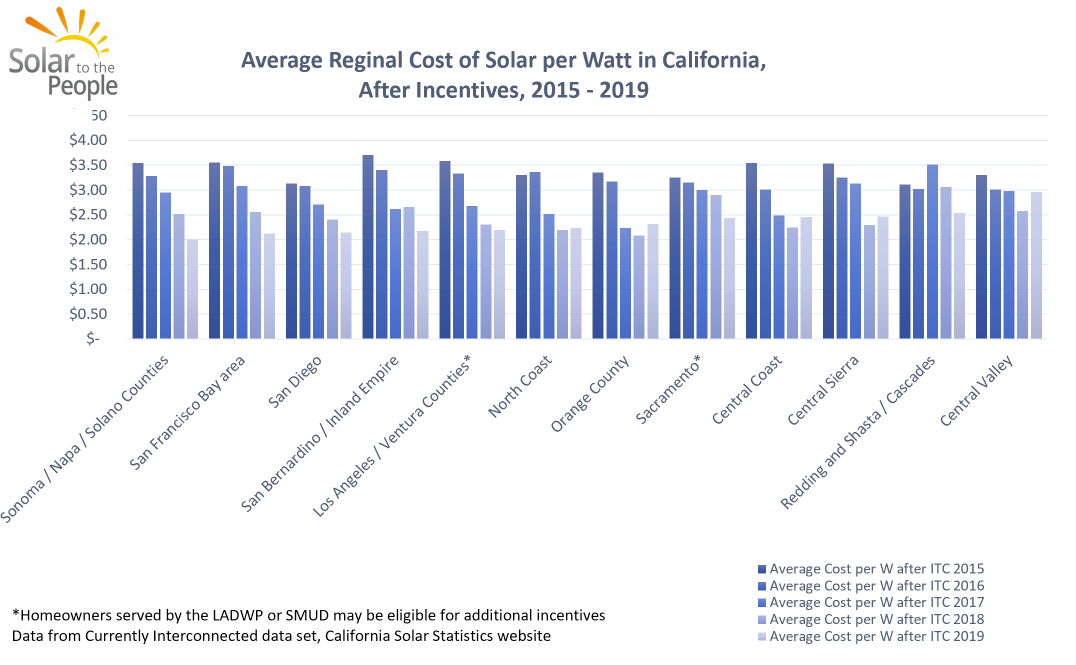
The Price of Solar per Watt in California
The graph above shows the average prices you can expect to pay per watt (W) for the different regions across the state. The price you pay per kilowatt varies slightly depending on your region, but the overall average price per W in California is $2.34. This average is calculated after the federal incentive has been applied. The lowest price per watt in 2019 was seen in Sonoma / Napa / Solano Counties ($2.00) while the highest ($2.96) was seen in both the Redding and Shasta/Cascades as well as Central Valley.
| Region | Average Cost per W post Incentives 2019 |
|---|---|
| Central Coast | $ 2.46 |
| San Francisco Bay area | $ 2.12 |
| San Diego | $ 2.14 |
| North Coast | $ 2.24 |
| Sonoma / Napa / Solano Counties | $ 2.00 |
| Los Angeles / Ventura Counties* | $ 2.19 |
| Orange County | $ 2.32 |
| Sacramento* | $ 2.44 |
| Central Valley | $ 2.96 |
| San Bernardino / Inland Empire | $ 2.17 |
| Central Sierra | $ 2.47 |
| Redding and Shasta / Cascades | $ 2.54 |
| Average | $ 2.34 |
About the Cost of Solar Index for California
At Solar to the People, our goal is to provide clear, third-party information to help homeowners make intelligent decisions about going solar. The Cost of Solar Index for California is our effort to help inform California homeowners about costs of going solar in the Golden State. The data for this study comes from the California DG Stats site, and is based on the newest state-wide data set which includes installation costs – the “Currently Interconnected” data set. Outliers were excluded, and the final data was based on 33,349 residential solar systems installed in California in the first six months of 2017.
Learn more – Is it Better to Lease or Buy Solar Panels in California?
Why Are Homeowners Going Solar in California?
- California has the highest cost of energy on the West Coast, and one of the highest costs of energy in the country.
- State and local net metering policies allow homeowners to get paid for excess power produced, and some regional price rebates still exist
More info on solar in your area
Discover how much you can save today
Solar doesn’t have to be confusing
Check out our Guide to Home Solar, everything you need to know about solar, in one place.